


aseball is a sport steeped in tradition and strategy. It's also steeped in statistics. From Babe Ruth's towering home runs to Sandy Koufax's dominant strikeouts, numbers have played a pivotal role in shaping the game's narrative. Whether you're a die-hard fan or a casual observer, understanding baseball stats can enhance your appreciation and understanding of the sport.
Statistics are the backbone of player evaluation, team strategy, and historical analysis. These numbers provide a tangible measure of a player's performance, offering insights into their strengths, weaknesses, and contributions to their team's success. Each metric, from batting averages to earned run averages, tells a story and sheds light on the game's nuances and intricacies.
This guide aims to demystify baseball statistics and equip you with the essential tools to navigate the vast landscape of baseball numbers effectively. Whether you're just starting your journey into baseball or looking to deepen your understanding of the game, this guide will serve as your roadmap, helping you decipher the language of statistics and unlock their secrets.
Let's embark on a journey through the captivating realm of baseball statistics. Together, we'll unravel the mysteries behind the numbers and discover how to uncover the hidden gems beneath the surface of America's beloved pastime.
The Importance of Baseball Statistics
In baseball, statistics serve as the quantitative backbone of the sport. They provide:
- A numerical measure of various aspects of the game.
- Valuable insights into player abilities.
- Data to inform team strategy.
Statistics in baseball refer to collecting, analyzing, and interpreting numerical data about player and team performance. This process enables the assessment of player contributions, team strategies, and overall success.
Understanding the role of each metric in the game is crucial for meaningful interpretation and analysis. Basic, traditional stats such as batting average, ERA, OBP, SLG, and RBIs provide valuable insights into player performance. However, they are best interpreted with factors such as player roles, game situations, and external variables like ballpark effects. We'll review all of these in this guide.
By grasping the basics of traditional and advanced baseball statistics and their significance within the game's broader context, you'll be able to appreciate baseball's intricacies and engage in informed discussions about player and team performance.
Traditional Baseball Statistics
Traditionally, baseball statistics have provided fundamental insights into player and team performance. Advanced metrics have expanded our understanding of the game, but traditional stats remain essential. Let's explore some critical traditional hitting and pitching statistics and their pros and cons.
Traditional Hitting Statistics
- Batting Average (AVG): Batting average measures a player's success by calculating the percentage of hits relative to at-bats. It's a simple yet widely recognized metric that reflects a hitter's ability to make contact with the ball and accumulate hits.
- Home Runs (HR): Home runs are the ultimate display of power in baseball, with each long ball contributing directly to a team's offensive output.
- Runs Batted In (RBIs): RBIs reflect a batter's effectiveness in driving in runs and ability to capitalize on scoring opportunities.
- On-base Percentage (OBP): OBP shows a batter's ability to reach base safely through hits, walks, and hit-by-pitches. It's calculated by dividing the sum of hits, walks, and hit-by-pitches by the sum of at-bats, walks, hit-by-pitches, and sacrifice flies.
Slugging Percentage (SLG): SLG measures a batter's power and ability to generate extra-base hits. It's calculated by dividing the number of bases earned from hits by the total number of at-bats.

Traditional Pitching Statistics
- Wins and Losses (W-L): Wins and losses reflect a pitcher's success in games they have started. Wins are often celebrated, but factors beyond the pitcher's control, such as run support from the offense, can influence games' outcomes.
- Earned Run Average (ERA): ERA measures a pitcher's success in avoiding earned runs. It is calculated by dividing the number of earned runs allowed by the number of innings pitched and multiplying by nine.
- Strikeouts (K): Strikeouts showcase a pitcher's ability to overpower hitters and generate outs without relying on the defense behind them.
Pros and Cons of Traditional Statistics
The pros of traditional statistics include the following:
- Simplicity: Traditional stats are easily understood and widely accessible, suitable for fans of all expertise levels.
- Historical Context: Many traditional statistics are part of baseball lore, making for easy comparisons across eras and generations.
- Baseline Evaluation: Traditional statistics offer a foundational framework for assessing player performance and their contributions to the team.
The innate cons of traditional statistics include:
- Limited Scope: Traditional statistics provide only a partial view of player performance. They omit crucial aspects such as on-base skills, defensive prowess, and situational effectiveness.
- External Factors: Team defense, ballpark dimensions, and run support can skew traditional stats, leaving an incomplete picture of player abilities.
- Overemphasis on Outcomes: Traditional statistics focus on outcomes rather than processes, potentially masking underlying trends and player skills.
Traditional statistics offer valuable insights, but we should view them within the game's broader context. Advanced metrics and situational factors can yield a more complete understanding of baseball and its dynamics.

Advanced Baseball Metrics and Sabermetrics
In recent years, baseball has seen a revolution in the analysis and interpretation of statistics thanks to the advent of sabermetrics. Sabermetrics, often called the "science of baseball statistics," is a data-driven approach that delves beyond traditional metrics to reveal more profound insights into player performance and team dynamics.
Sabermetrics, coined by renowned baseball analyst Bill James, includes a wide array of advanced methods for evaluating player contributions, predicting future performance, and optimizing team strategies. Unlike traditional numbers, which primarily focus on surface-level measures, sabermetrics dives into the game's intricacies, weighing factors such as situational context, player roles, and external variables.
Examples of Advanced Metrics
- WAR (Wins Above Replacement): WAR reflects a player's total contribution to their team's success compared to a replacement-level player. It integrates various aspects of player performance, including offense, defense, and baserunning, into a single value that allows for comprehensive player assessments.
- OPS (On-base Plus Slugging): OPS combines a batter's on-base percentage (OBP) and slugging percentage (SLG) to give a complete measure of offensive prowess. It offers a more comprehensive evaluation of a player's ability to reach base safely and generate extra-base hits.
- FIP (Fielding Independent Pitching): FIP assesses factors within a pitcher's control, such as strikeouts, walks, hit-by-pitches, and home runs allowed. It excludes outcomes influenced by defense to more accurately reflect a pitcher's skill level.
The Importance of Advanced Metrics
Advanced metrics are crucial in gaining deeper insights into player performance and team dynamics. By accounting for a broader range of factors and using a more nuanced approach, sabermetrics enables more informed decisions regarding player evaluation, lineup construction, and in-game strategies.
Moneyball provides an illustrative example. The hit film chronicles the real-life efforts of the Oakland Athletics baseball team to compete with limited financial resources. General manager Billy Beane, portrayed by Brad Pitt, uses sabermetrics to find undervalued players and build a competitive squad. His approach challenges conventional baseball wisdom and reshapes the sport's landscape.
Moneyball vividly showcases the transformative power of sabermetrics in player evaluation and team management. Many teams across MLB have tried to adopt the Athletics' approach to varying degrees.
While traditional stats offer valuable sights, advanced metrics provide a broader understanding of the game. With sabermetrics, fans can find hidden trends, spot undervalued players, and ultimately enhance their appreciation and comprehension of baseball.

Statistics in Player Evaluation
Baseball teams and their scouts heavily rely on statistics in the player evaluation processes. This data informs roster decisions, draft picks, and trade negotiations. Statistics help teams identify talent, assess potential, and optimize roster composition.
How Teams Use Statistics
- Performance Analysis: Teams and scouts use statistics to evaluate players' past performance and project future potential. To comprehensively understand players ' abilities, they examine traditional stats like batting average and ERA and advanced metrics such as WAR and OPS.
- Scouting and Drafting: Statistics play a crucial role in scouting and drafting players at the amateur and professional levels. Scouts assess players' statistical performance alongside their physical attributes, skills, and intangibles to find prospects with the most potential to succeed.
- Roster Construction: Teams use statistics to construct balanced rosters that optimize performance across various positions and skill sets. They consider positional scarcity, defensive prowess, and offensive production to make roster decisions and lineup adjustments.
- The 20-80 Prospect Scale: The 20-80 scale is used in prospect evaluation. Each tool or skill is graded on a scale from 20 to 80, with 50 representing the major league average. For example, a grade of 60 in hitting ability reflects an above-average player. In contrast, a grade of 40 indicates below average.
Tips for Fans on Using Statistics
- Reading Stats on a Player Profile: Look at both traditional and advanced metrics. Go beyond surface-level statistics like batting average and ERA and consider metrics that give a more complete picture of a player's performance, such as OPS, FIP, and WAR.
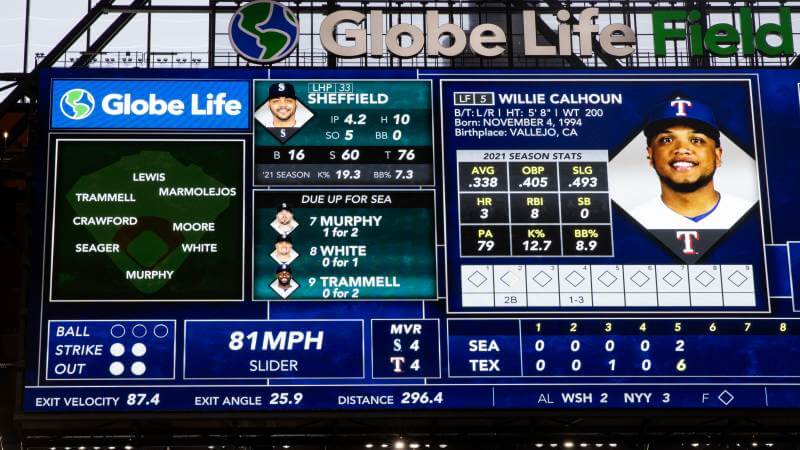
- At the Ballpark: When watching a game at the ballpark, keep track of relevant statistics for players on both teams. Note key metrics such as on-base percentage, slugging percentage, and fielding percentage to assess real-time performance. Additionally, observe players' situational performance, such as their performance with runners in scoring position or high-pressure situations. Scoreboards are ripe with various statistical measures throughout the game.
- Know Your Metrics: Familiarize yourself with traditional and advanced baseball statistics. Learn how different metrics are calculated and what they reveal about players' skills and contributions.
- Consider Context: When assessing player stats, weigh contextual factors such as park effects, era adjustments, and player roles. Contextualizing statistics can provide valuable insights into a player's performance relative to their environment and circumstances.
- Use Multiple Metrics: Avoid relying on one statistic to judge player performance. Instead, use a combination of metrics to understand a player's strengths, weaknesses, and overall value.
By grasping how teams use statistics, fans can better appreciate the role of stats in baseball and better understand the game. Whether analyzing player profiles or watching games at the ballpark, statistics offer valuable insights that enhance the overall enjoyment of the sport.
Avoiding Common Pitfalls
It's easy to fall prey to common misconceptions and pitfalls in baseball statistics. Avoiding these traps requires a critical eye and a desire to understand how traditional and advanced statistics work together. Let's explore some of the pitfalls and how to avoid them.
Common Misconceptions
- Correlation and Causation: Just because two statistics are correlated does not necessarily mean one causes the other. For example, a high batting average may correlate with a team's success. Still, it doesn't mean that batting average directly causes wins.
- Sample Size: Small sample sizes can lead to misleading conclusions. Larger samples give more reliable insights into player performance.
- Neglecting Context: Context matters when interpreting statistics. It's easy to only look at the stats in front of you. However, failing to consider factors such as park effects, era adjustments, and player roles can lead to flawed assessments.
Holistic Analysis
- Single-Stat Syndrome: Relying solely on one statistic can be misleading. Baseball is multifaceted, and no single metric can capture a player's contributions. Instead, take a holistic approach by weighing a range of metrics and factors.
- Understanding the Big Picture: View baseball stats within the game's broader context. Consider a player's strengths, weaknesses, and overall impact on the team. Look beyond individual statistics to assess a player's contributions to team success.
Critically Evaluate Claims and Interpretations
- Verify the Source: When encountering statistical claims or interpretations, consider the expertise of the individual or organization making the claim. Reliable sources are backed by credible research and expertise in statistical analysis.
- Scrutinize Methodology: Examine the methodology behind statistical analyses to ensure they are sound and rigorous. Look for transparent data collection, analysis techniques, and assumptions.
- Consider Alternative Explanations: When presented with statistical claims, consider other explanations and potential variables. Critical thinking involves questioning assumptions and exploring different perspectives to arrive at well-informed conclusions.
Fans can develop a more nuanced appreciation of the game by avoiding common pitfalls, adopting a holistic approach to statistical analysis, and critically evaluating claims and interpretations. Stats are valuable, but use them thoughtfully.
Using Statistics to Engage with Baseball
Whether you're a casual fan or a dedicated die-hard, there's always something new to discover in baseball analytics. Still, exploring and learning about baseball statistics is easier than you may think. Dive into books, websites, and statistical tools. Be bold, ask questions, challenge assumptions, and seek alternative perspectives.
Recommendations for further exploration and reading include:
- A Fan's Guide to Baseball Statistics, by MLB.com writer Anthony Castrovince, provides an accessible and fun way to learn about baseball statistics all in one place.
- FanGraphs: FanGraphs is a premier destination for baseball analysis, offering various tools, articles, and insights. FanGraphs provides comprehensive coverage of the game's analytical side, from advanced metrics to player projections.
- Baseball Reference: Baseball Reference is a comprehensive database of baseball statistics featuring player and team data across generations. Whether researching historical stats or tracking current player performance, Baseball Reference is invaluable for fans and analysts alike.
- Baseball Savant, powered by Statcast: Statcast, developed by Major League Baseball, provides cutting-edge player tracking data and advanced metrics. With features such as exit velocity, launch angle, and defensive metrics, Statcast offers unparalleled insights into the game's nuances.
Baseball statistics are more than just numbers—they're the language of the game. They tell stories of triumph, perseverance, and the relentless pursuit of excellence. Through statistics, fans can deepen their appreciation and understanding of the game, gaining a newfound admiration for the players, teams, and strategies that make baseball unique.
So, as you embark on your journey through the world of baseball statistics, remember to keep an open mind, stay curious, and enjoy the ride. Whether you're crunching numbers in a spreadsheet or cheering from the stands, statistics offer a way to enjoy the game on a whole other level.
Don’t forget to make The Youtini Baseball Show your weekly listen for ongoing baseball content throughout the season. New to baseball? Our Complete Beginner’s Guide to Major League Baseball is for you.
Whether it’s our weekly show, helpful guides, or connecting with your fellow fans, join our Youtini baseball community today!


